
System K.A.R.L.®
K.A.R.L.® System
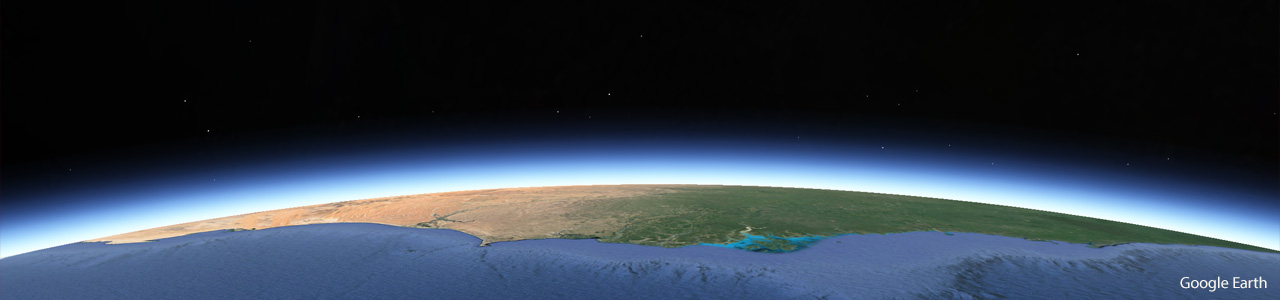
With K.A.R.L. natural risks can be identified, analyzed, and quantified on a worldwide scale. The K.A.R.L. result exceeds by far the interpretation of commercially available hazard maps.
What is special about K.A.R.L.®?
On hazard maps, large-scale zones which are affected by natural hazards are depicted. These zones symbolize the expected effect of a given return period, e.g. a 100-year-event in the case of flooding, the 475-year-event in the case of an earthquake.
For the region concerned this is a reliable hazard index, but this does not necessarily correspond to the risk situation for a specific location.
The precise analysis of any given location is the distinctive feature of K.A.R.L.
K.A.R.L. not only evaluates historical data but also considers amongst other data, the precise elevations, the soil texture and the shape of the landscape around the location. From this data K.A.R.L. calculates risk information on return periods from the 10- to the 10.000-year event to model the risk from natural hazards.
This results in highly significant analyses, taking into consideration local characteristics as well as the specific sensitivities (vulnerabilities) of buildings, installations, means of production and stored goods regarding each natural hazard. These sensitivities significantly influence the risks of a company.
For example, a hail event can be devastating for cars in open air storage, but insignificant for cars in a warehouse. The situation is completely different in the case of an earthquake: here, cars in warehouses are exposed to greater risk, as they can be damaged by falling parts or even by the collapse of the building.
Only K.A.R.L. considers this crucial aspect in its risk analysis and therefore can determine a realistic risk indicator for a site